TradingView Charts: Every Execution Plotted on the Price Action
Your trades now plot directly on an interactive TradingView chart inside My Prop Journal. See exactly where you entered and exited, hover over any execution for a full details tooltip, and analyze your trades with the same charting tools you already use.
Numbers alone don't tell the full story of a trade. Seeing your entries and exits plotted on the actual chart — in context, at the right timeframe, with price action around them — is a completely different way to understand what happened. TradingView chart integration brings that directly into your trade reviews and report cards.
What's New
TradingView Charts in Trade Reviews and Report Cards
TradingView charts are embedded directly inside Trade Reviews and Report Cards. When you open a trade review or pull up a report card, the chart loads automatically for that trade's session — the right ticker, the right date, no manual setup required.
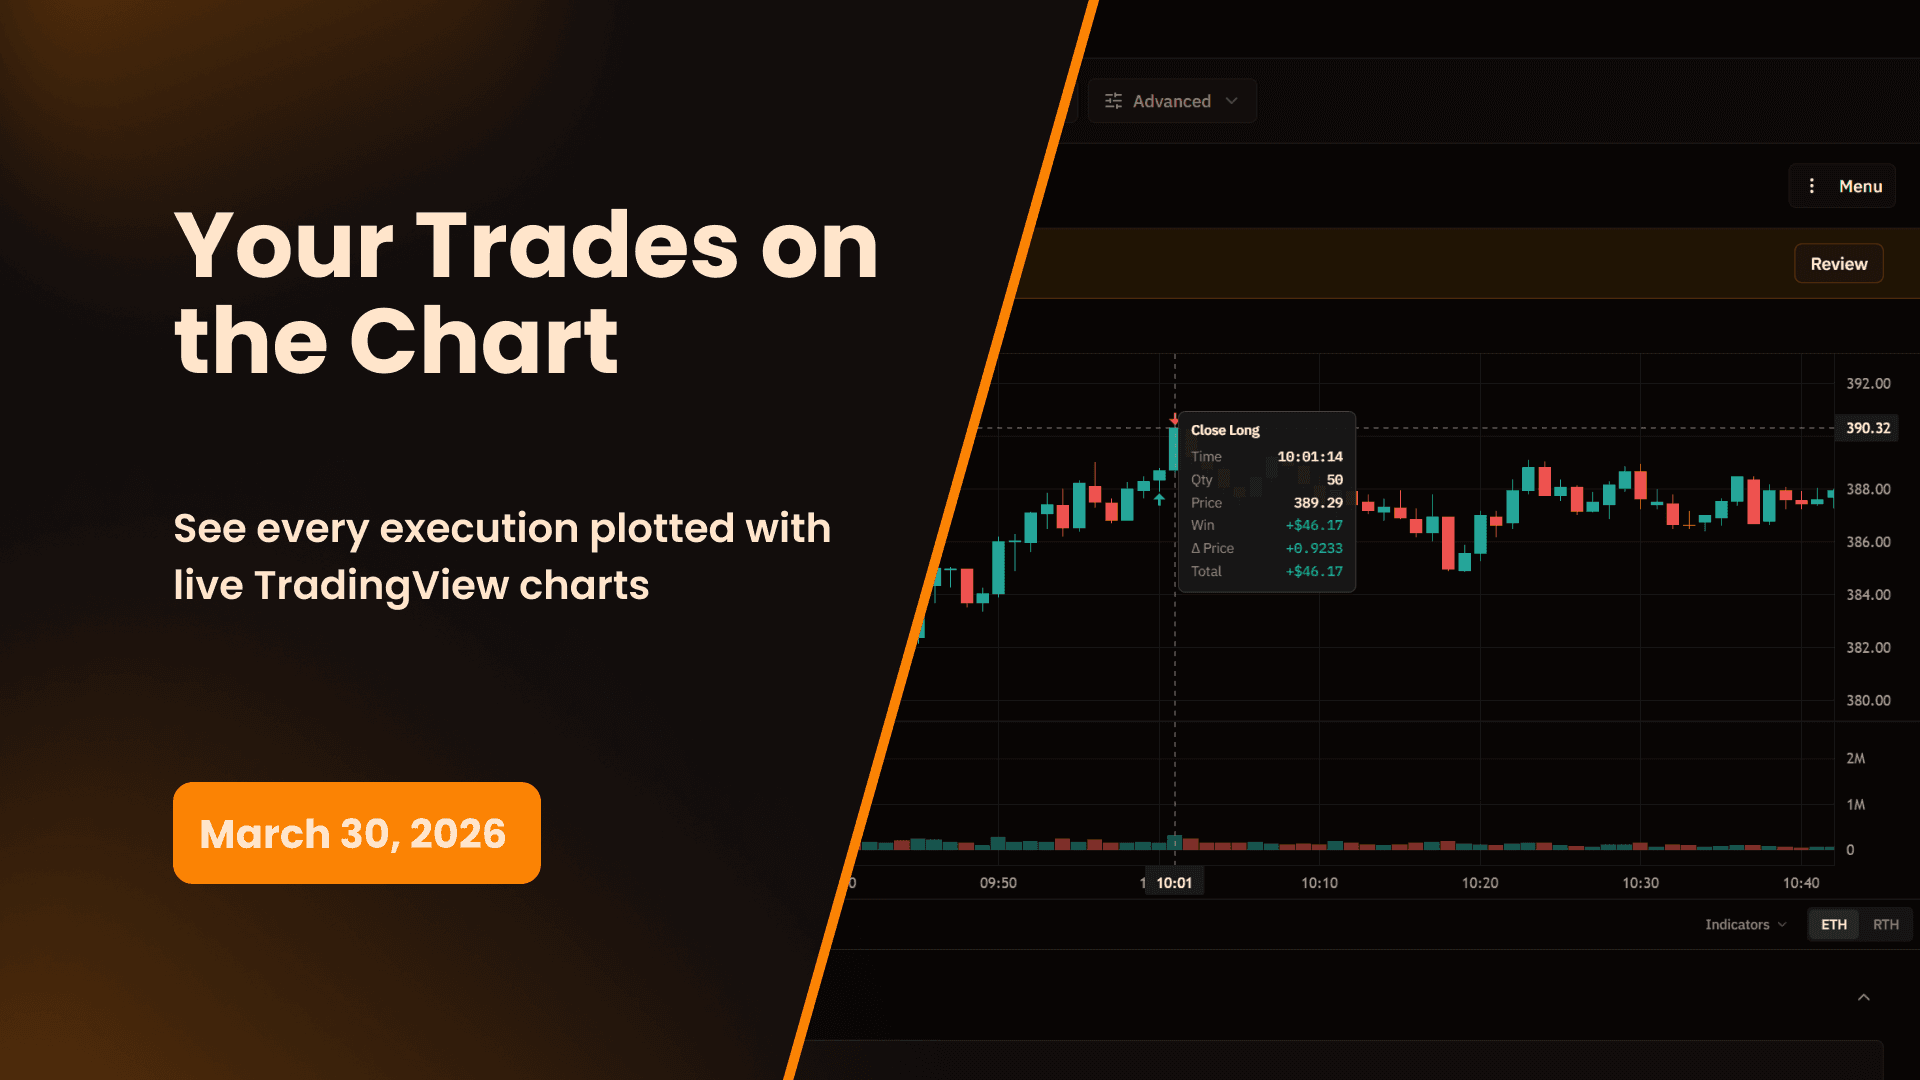
Your executions are plotted directly on the chart — entry and exit markers appear at the exact price and time they occurred, giving you an immediate visual picture of where you got in, where you got out, and what the price action looked like around your decisions.
Execution Tooltips
The standout feature of this integration is what happens when you hover over an execution marker on the chart. A custom tooltip appears showing the complete details of that execution:
- Side — Open or Close, Buy or Sell
- Timestamp — Exact date and time of the execution
- Quantity — Number of shares or contracts
- Total Quantity — Cumulative position size at that point
- Price — Execution price
- Average Price — Average fill price across the position
- Commission — Commission charged on that execution
- Gross P&L — Gross profit or loss at that execution
- Net P&L — Net profit or loss after commissions
Everything you need to understand that specific execution is right there on the chart, without clicking away or switching panels. You can hover across multiple executions in sequence and get the full picture of how the trade unfolded, execution by execution, directly on the price action.
Chart Controls
The chart includes a set of controls to customize your view:
Timeframes — Switch between 1, 2, 5, and 15 minute views. Move between timeframes to see your trade in different contexts — the 1-minute for precise entry and exit analysis, the 5 or 15-minute for the broader structure around your trade.
Session Display — Toggle between Regular Trading Hours and Pre-Market view. If you traded the pre-market session or want to see how price behaved before the open relative to your trade, switch to the extended session view.
Drawing Tools — Add horizontal lines to mark key levels — VWAP, daily highs and lows, support and resistance — directly on the chart. Add vertical lines to mark specific time-based levels like the open or a news event. These are temporary and specific to your current review session.
Chart Overlays — Toggle volume bars on or off to see where volume was coming in relative to your executions. Toggle crosshairs or magnet crosshairs for precise level identification.
Indicators — Access a selection of indicators to add to the chart for deeper context during your review.
Why This Matters
Context Changes Everything
A $2.87 loss on a short trade looks different when you can see exactly where on the chart you entered, that price was mid-range with no clear structure behind the entry, and that the stock was pushing higher on strong volume when you got in. The number tells you what happened. The chart tells you why.
Being able to see your executions on the chart — not in a table, not in a P&L summary, but right there on the price action — is what makes trade review genuinely useful rather than just data collection.
Hover, Don't Click
The tooltip design is intentional. You don't need to click into an execution, open a sub-panel, or navigate anywhere to see the details. Hover over the marker and everything is right there. This keeps your attention on the chart where it belongs — you're reading price action and checking your execution details in the same visual space without breaking your focus.
Review Faster, Learn More
When reviewing a session with multiple trades, being able to scan across all your executions on one chart — hovering to check details as you go — is significantly faster than reviewing each trade in isolation through a table view. You see the full session story at once and can compare trades against each other in the same context.
How to Get Started
TradingView charts load automatically inside Trade Reviews and Report Cards. No setup required.
- Open any trade in Trade Reviews, or open a Report Card
- The TradingView chart loads automatically for that session
- Hover over any execution marker to see the full execution tooltip
- Use the timeframe buttons to switch between 1, 2, 5, and 15-minute views
- Toggle pre-market session, volume, crosshairs, or indicators using the chart controls
TradingView chart integration is available on all plans.
Start 14-Day Free Trial | View All Features | Contact Support
My Prop Journal - The complete trade journal for traders. Review every trade with TradingView charts and execution-level analysis.
Share this release
Newsletter
Stay Updated on Latest Features
Get notified about the latest feature releases, platform improvements, and product updates from My Prop Journal.