Transform data into actionable insights
Turn your trade journal data into powerful insights with advanced performance analytics. Track metrics, visualize patterns, and make data-driven decisions to improve your trading results.

Everything you need to analyze your performance
Transform your trade journal data into actionable insights with comprehensive analytics. Track every metric that matters to your trading success.
Your complete performance analytics suite
Advanced analytics that reveal the patterns in your trading and help you find your edge.
Features
Performance Overview & Top Tickers
Get a complete summary of your performance at a glance. See your top-performing tickers and quickly identify your best and worst assets.

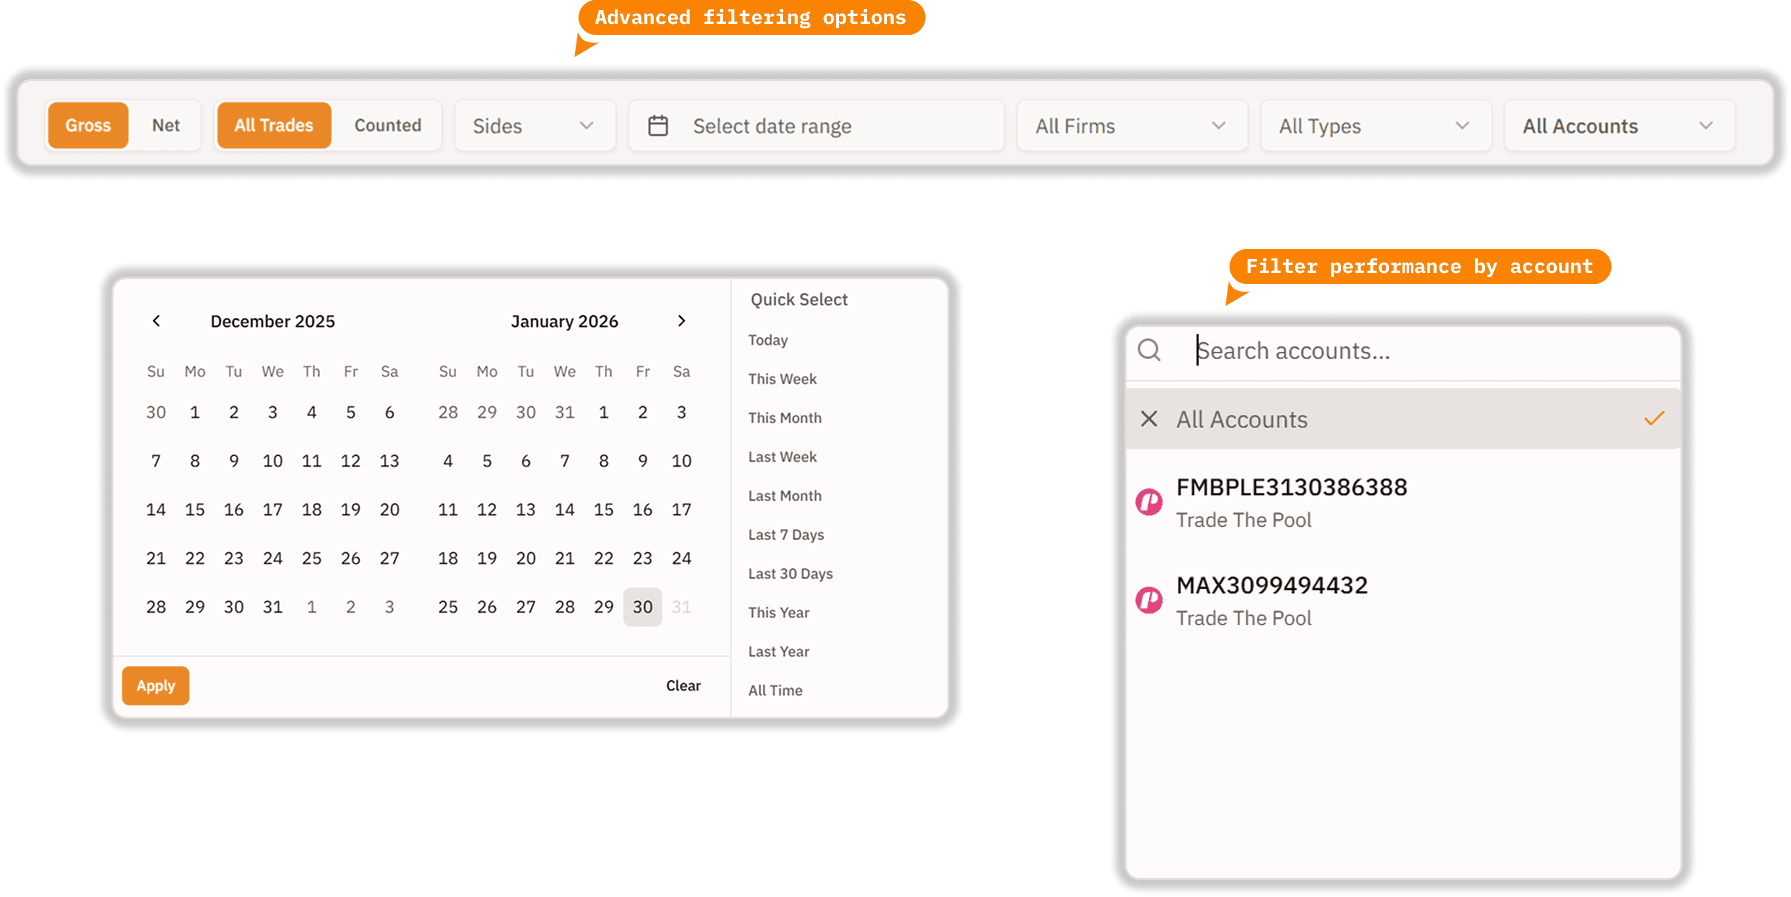
Advanced Filtering & Account Selection
Filter analytics by account, date range, and more. Compare performance across accounts and time periods.
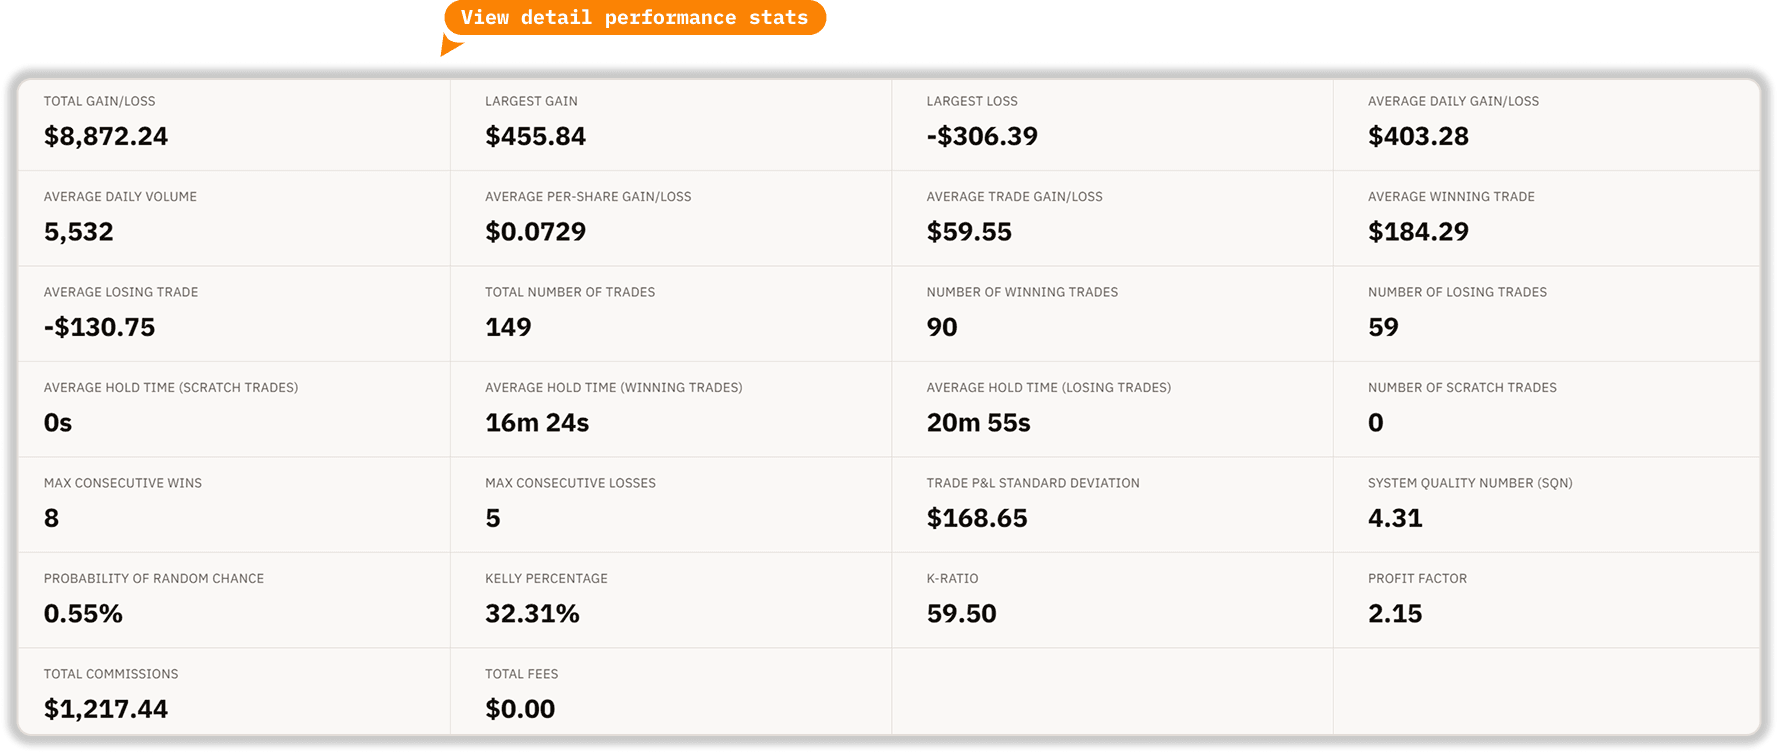
Detailed Performance Statistics
Dive deep into every performance metric. Understand your win rate, profit factor, average trade, and hundreds more data points.
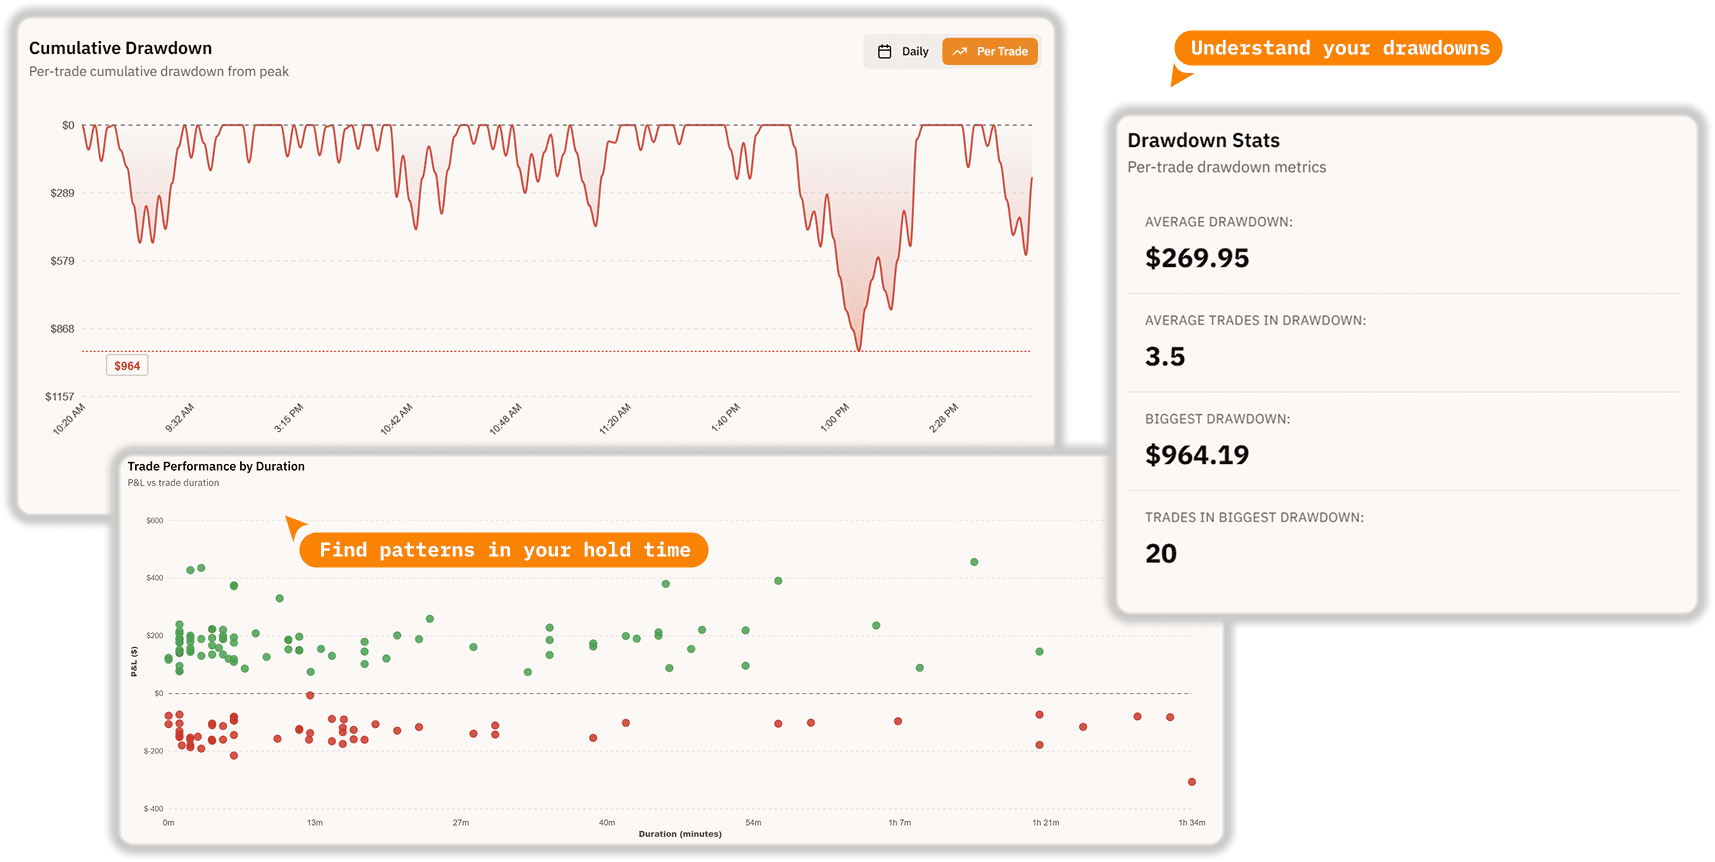
Equity & P&L Charts
Visualize your account growth and daily P&L with interactive charts. See how your performance evolves over time.
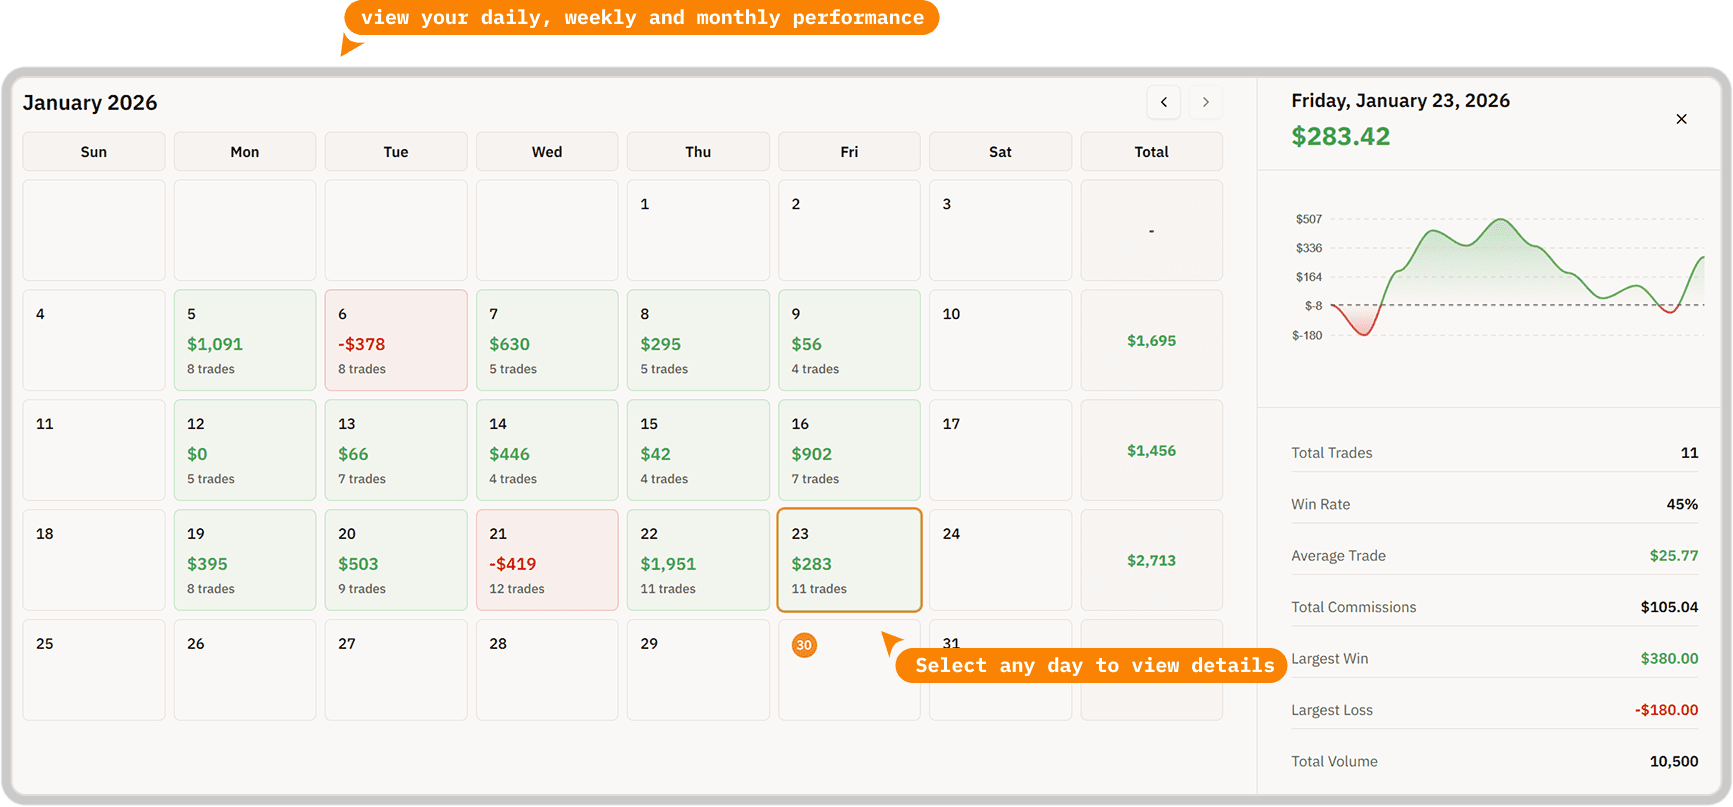
Calendar View
View your trading performance in a calendar format. Instantly spot your best and worst days, weeks, and months.
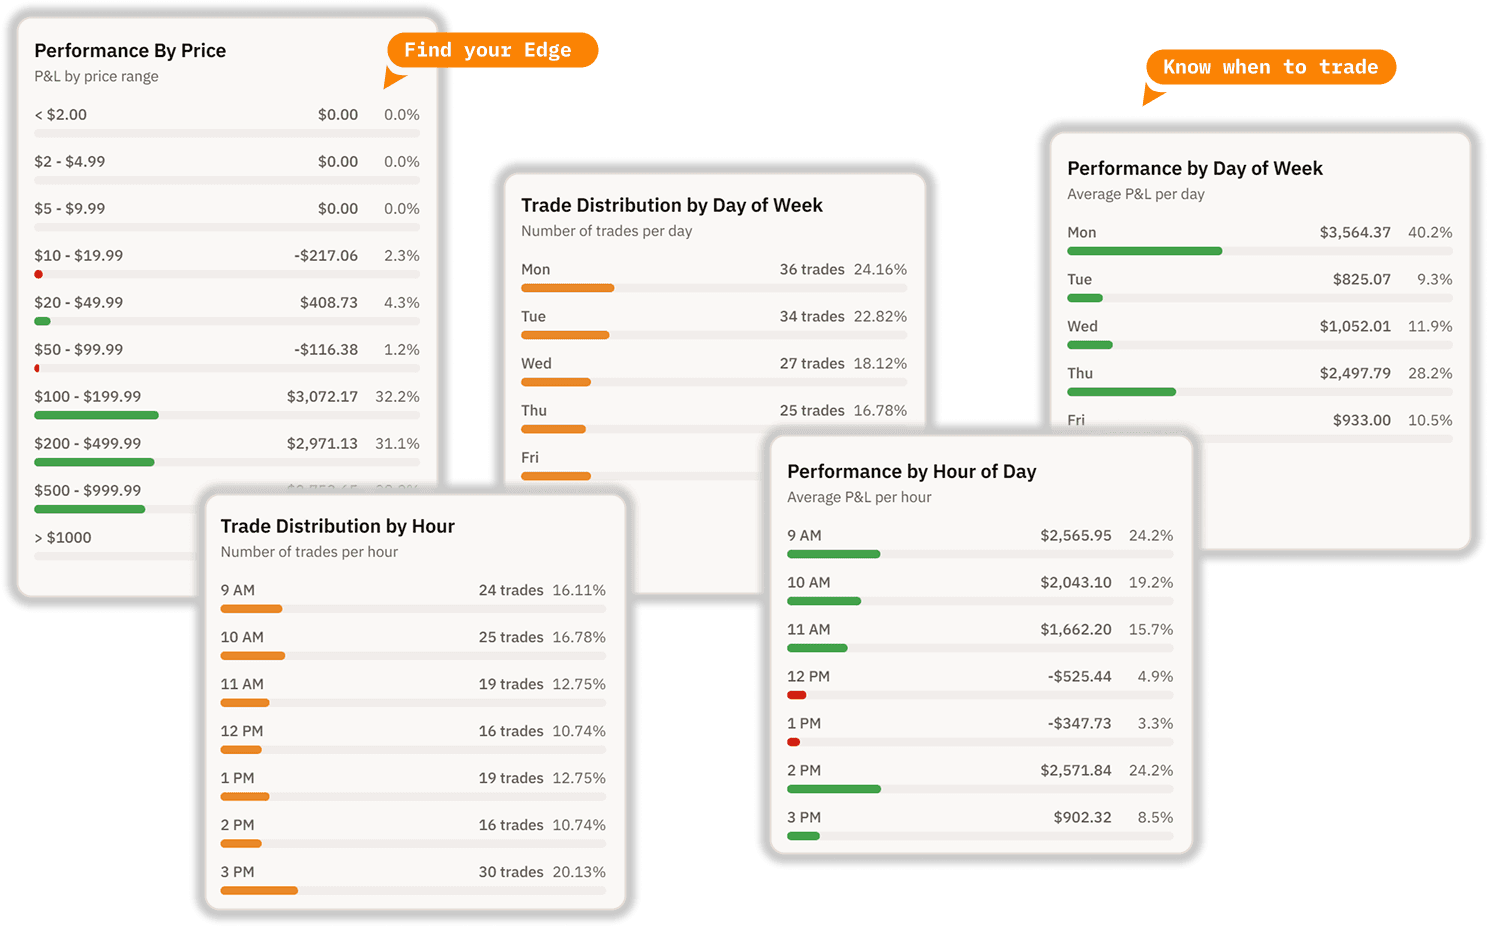
Time of Day Analysis
Discover which hours of the day you trade most profitably. Optimize your trading schedule based on your own data.
Why My Prop Journal?
Most analytics tools just show numbers. We help you understand what drives your results and how to use data to make better decisions.
Make Data-Driven Decisions
Stop guessing and start knowing. Use comprehensive performance metrics and proven patterns to make informed trading decisions backed by your actual results.
Find Your Trading Edge
Discover what makes you profitable. Identify which times, price ranges, and setups work best for your style. Know when to trade and when to stay out.
Track Your Growth
Monitor your progress with historical performance tracking. See improvements in your metrics over time and learn from both winning and losing periods.
Improve Consistency
Turn insights into action. Identify patterns in your best and worst trades, optimize your approach, and develop a more consistent, profitable trading process.
Ready to find your edge?
Start tracking your performance with powerful analytics that help you understand your trading and make better decisions.